Last week, we witnessed a spike in volatility in the technology sector as rising interest rates fostered concerns of stretched valuations and overcrowded trades. In fact, despite a modest recovery on Friday, the Nasdaq finished more than 4% lower over the week. To see how investors positioned themselves heading into this quarter, and how that may have impacted trading last week, we took a close look at the data.
For the purpose of this analysis, we examined all 75 constituents in the S&P IT Index. We then broke that data down further to take a more granular view of the 6 sub-sectors comprising that Index, including: Software, Semiconductors, Communication Equipment, Electronic Equipment & Instruments, IT Services, and Technology Hardware Storage & Peripherals.
Technology Sector Overview
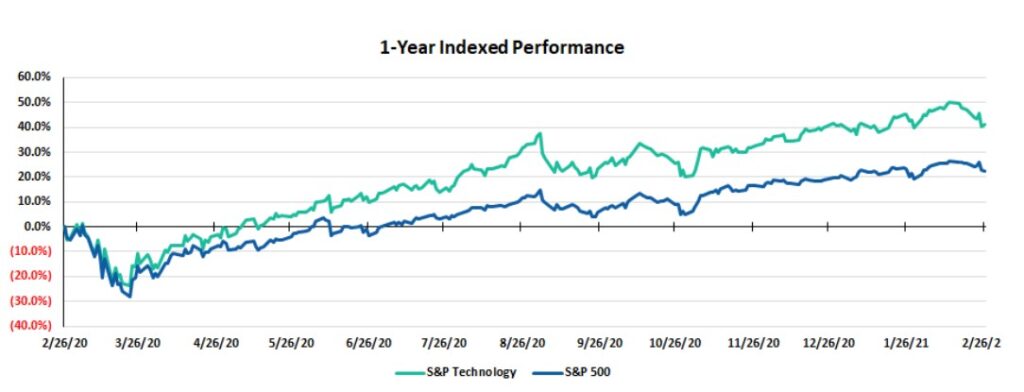
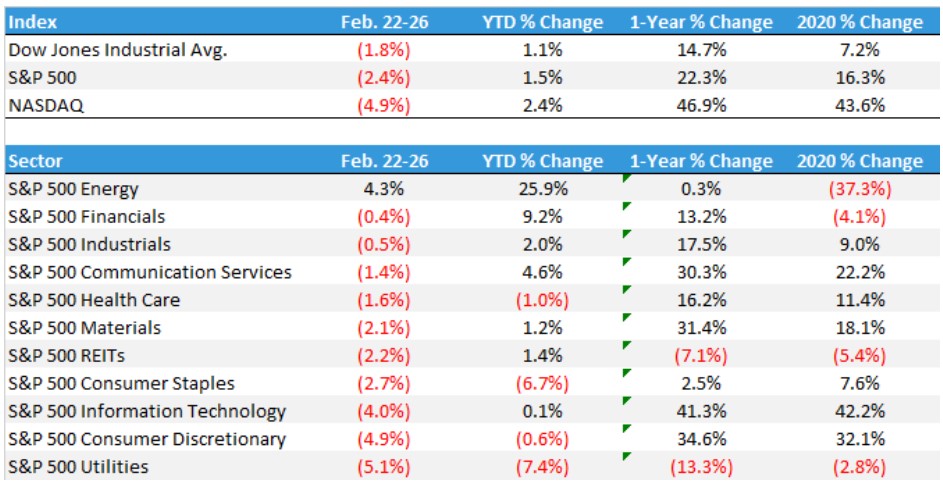
Technology (+42%) was the top performing sector in 2020 as traders flocked to mega cap names like FAANG for safety, while opportunistically buying individual stocks that were poised to benefit from work-from-home and lockdown conditions (such as Zoom Communications). Although the sector managed to finish up 11.5% in Q4’20, Tech was only the 6th best performing sector that quarter as investors began to rotate capital into other opportunities.
The rapid rise in interest rates in recent weeks has put even more pressure on tech stocks, as these companies heavily rely on the ability to borrow money at low rates to fund future growth investments. The S&P Technology sector finished last week down 3.3% despite a rally on Friday. The sector has dropped down to the 7th best sector for the year at roughly +0.8% through February 26th.
Looking at Q4’20 shareholder filings, it was clear that fast money hedge funds and growth-oriented investors continued to buy the sector and drive upside in Technology over the fourth quarter while low-turnover, long-only institutional investors moved to book profits. In certain instances, institutional investors did deploy capital to certain names but were outweighed by aggressive selling by large asset managers. The recent trends of institutional selling combined with hedge funds flipping to the sell-side quickly have likely greatly exacerbated the selloff we observed last week.
A Closer Look at the 6 Technology Index Sub-Sectors
- Software
Software companies within the S&P Technology index held up well over Q4’20, as the average price increase for each individual within the group increased by ~14.5%. PAYC (+45.3%) outpaced the group while CRM (-11.5%) lagged.
The clear trend driving upside in the group was faster money Brokers and Hedge Funds buying. Morgan Stanley & Co. and Millennium Management led the activity and increased their exposure by $2.6B and $2.1B respectively. Polar Capital (+$1.4B); Viking Global (+$1.2B) and Soroban Capital Partners (+$1.0B) are other well known firms that added significantly to the space. Morgan Stanley & Millennium increased exposure to most of the group while Viking sized up specifically in MSFT (+$797M) and NOW (+$423M). Soroban was a significant buyer in MSFT, accumulating roughly $1.04B worth of shares in the quarter.
On the opposite side, large institutional investors such as Fidelity (-$6.0B), Jennison (-$1.5B) and Capital Research & Management (World Investors) (-$1.4B) moved to book net profits in the sub-sector heading into the year-end. Fidelity sold heavily in MSFT, ADBE, and CRM, Jennison sold in MSFT, CRM, and NOW while Capital World reduced exposure to NOW, MSFT, NLOK, and ADSK.
Finally, Passive Index investors Vanguard (-$2.9B), SSgA (-$3.6B) and BlackRock Fund Advisors (-$1.1B) who remain the top three holders in the subsector all sold aggressively across most of their holdings within the group, perhaps implying some Index rebalancing in the quarter to be less consolidated.
- Semiconductors
Semis held up really nicely over Q4’20 as the group rose ~30.0% on average during the quarter. ENPH rose ~112.5% to outpace while INTC was the laggard, falling ~3.8%.
Upside in the group was again driven largely by fast money hedge funds and brokers such as Millennium Management (+$2.6B), Morgan Stanley & Co. (+$1.6B), Baupost (+$953M) and UBS Securities (+$876M).
Meanwhile, larger long-only institutional investors such as T. Rowe Price (-$3.3B), Capital Research & Management (World Investors) (-$3.1B), Wellington (-$2.3B), and PRIMECAP (-$1.2B) booked profits on the run up. The largest holders and Passive Index investors within the subsector (Vanguard, BlackRock Fund Advisors and SSgA) all emerged as sellers within the group during Q4’20 as well.
- Communication Equipment
Communication Equipment also performed very well last quarter, with an average gain of 22% led by FFIV (+43.3%) and ANET (+40.4%).
This group seemed to buck the trend as hedge funds were not very involved in the space’s rally. In fact, we saw a few value-oriented investors like Perkins Investment Management, Dodge & Cox, and Arrowstreet Capital step up and add to their positions. Big names like Wellington and Capital Group continue to find the space attractive and added $293M and $225M to these companies as well. The only real notable hedge fund buying came on behalf of D.E. Shaw, which added heavily to CSCO (+350M), MSI (+$19M) and ANET (+$7M).
Meanwhile, GARP investors like Janus Capital Management (-$660M), Parnassus (-$434M), and Newton Investment Management (-$311M) pared back their positions aggressively. These three firms still had sizable exposure left in the space, leaving room to continue adding pressure to those stocks last week.
- Electronic Equipment & Instruments
Electronic Equipment was another unique subsector in that it did not see much hedge fund involvement heading into the end of the year. However, the institutional activity was heavily slanted to the sell-side as the top 10 sellers divested roughly $3.5B worth of stock compared to only $2.3B of accumulations from the top 10 buyers.
Wellington (+$312M), Lord, Abbett (+$286M), and Winslow Capital (+$246) were among the top buyers in Q4. TE Connectivity (TEL) and Trimble (TRMB) were the largest recipients of those capital flows, though Amphenol Corp. (APH) and Keysight Technologies (KEYS) garnered some attention as well. Of note, Polar Capital once again is among the top buyers of the subsector, adding to its positions in FLIR, IPGP, KEYS and TEL.
On the sell side, Dodge & Cox was a substantial mover as it cut its exposure by roughly $881M to the group. The firm still holds one of the top positions in the space but continues to take profits as the sector rallies. T. Rowe Price (-$571M) is another top institution that cut its position in almost every company with the exception of APH and TRMB. GARP and Value investors rounded out the rest of the top sellers and we suspect have continued to put pressure here in Q1’21.
- IT Services
Despite the gains this subsector experienced last quarter, ownership trends were beginning to trend in negative directions that could prove problematic in 2021. Fidelity has been a massive seller in the space, unwinding over $5.7B in exposure in the fourth quarter. The selling was spread across most of the group, but MasterCard (MA) and Visa (V) saw the biggest outflows with over $2B worth each. Other big names like Massachusetts Financial Services (-$1.6B) and T. Rowe Price (-$837M) piled on along with several other long-only institutions.
Once again, some of the fast money hedge funds and brokers have been driving most of the upside in the space. Viking Global Investors was the top buyer with just over $1.4B in purchases. The hedge fund added over $823M of capital into Visa and over $417M to Fidelity National Information Services (FIS). Morgan Stanley & Co. has been active in the entire technology sector and picked up $1.3B, while Melvin Capital Management (+621M) is another high turnover hedge fund that could flip their shares quickly on sharp market pullbacks.
- Technology Hardware Storage & Peripherals
This subsector saw plenty of growth and capital in 2020 with companies like Apple rallying over 80% on the year. HP Inc. added 20% over that time while Hewlett Packard Enterprise fell by almost 25%.
Millennium Management was once again among the top buyers as it added just shy of $2.2B worth of capital. The bulk of that came from its addition in Apple, but HPE and STX saw inflows as well. The Morgan Stanley and Sesquehanna brokers were also net buyers, adding $820M and $751M respectively. We did see some institutional involvement from names like RBC Capital (+$1.5B), Fidelity (+$1.3B), Polar Capital (+$768M) and TIAA-CREF (+$959M), but for the most part institutional investors were heavily skewed to the sell side.
As we have seen across a few subsectors, the rate of divestitures from the top firms has significantly outpaced the inflows. Berkshire Hathaway was a major seller in Apple and sold roughly 57M shares or $7.5B worth of stock. T. Rowe Price also cut its exposure to every company in the space for a total $2.5B. Adding to the pressure, index funds like State Street Global Advisors (-$4.7B), Vanguard (-$3.1B), BlackRock Fund Advisors (-$1.8B) and Northern Trust Investments (-$812M) all saw significant outflows.

Key Takeaways for IROs:
Given the sell-off that we saw across the tech sector by the large long-only institutions, now is the time to stay close to the funds that have new capacity to accumulate shares in your stock. If your stock has moved up or down enough to cause a recategorization of your market cap, or you have moved from Growth to Value, for example, be sure to get in front of this new group of potential investors that is better suited to own your stock.
Additionally, revisit those investors that were waiting on the sidelines because your stock was too expensive. Identify who they are, reach out to them, educate them, and monitor their presence on your website or participation in future earnings calls. These tactics will bolster your efforts to convert potential investors into new shareholders and bring some stability back to your stock.
For additional insights and best practices on navigating today’s market, watch our 2021 Strategic Planning for IR webinar on-demand.